Flood Risk Mapping and Data

We supply UK flood information in many formats for customers with assets at risk of damage from flood intrusion.

Talk to us about Flood Risk

An estimated five million households (1 in 5) are at risk to flooding in the UK, with annual damages estimated between £500 million and £1 billion each year.  Data from UK Climate Projections (UKCP) indicates that UK is likely to receive more bouts of heavy rain, more frequently, as a result of climate change. The number of flood events is likely to increase, and along with it, the potential for loss and damage.  Comprehensive flood data is key to managing the risk both now and in the future.   

We’re one of the top suppliers of flood mapping and intelligence, helping businesses who need to predict and manage the risk from seasonal flooding - rivers, coastal, groundwater We supply all the main flood models from leading specialists JBA and Ambiental, to 15 FTSE 100 companies, top insurers and 4,000 other businesses in the UK.

Understanding Flood Risk

From April 2022 it is mandatory for the largest UK-registered companies and financial institutions to to disclose climate related financial information inline with TCFD (Task Force on Climate-Related Financial Disclosures) recommendations. 

Data that identifies current and future risk from climate-related factors such as flood is vital to that activity.

Our climate intelligence and web services can drive your automated outputs, feed into consumer-facing reports, and give you the foundations on which to build strong and measurable insights about your climate-related, physical and transitional risk management.


Talk to us about a bespoke solution for you.

Image showing where might flood on the landscape

Twinn FloodMap Climate

5m resolution, climate-adjusted, fluvial, pluvial and tidal flood mapping for GB from Twinn (formerly Ambiental). Updated annually.

Product Details

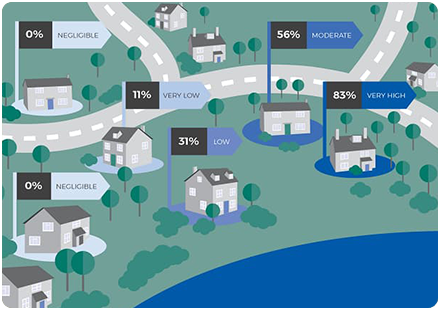
Provides a view of current and future flood hazards (fluvial, pluvial and tidal) for three return periods, three epochs and three emissions scenarios to estimate potential impact on asset portfolio and satisfy ESG disclosure requirements.

Product Details

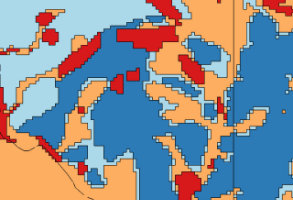
FloodMap Climate is a high-resolution, climate adjusted flood map using local hydrological data, high-resolution terrain models, and climate uplift data to create a view of current and future hazards (fluvial, pluvial and tidal).  FloodMap Climate replaces the previous FloodFutures product (which is no longer updated).  

The impact of global warming and rising sea levels is intensifying, and every one of us will need to adapt and plan in the face of uncertainty. The UK is witnessing higher temperatures and changing rainfall patterns with unprecedented combinations of drought and flood conditions caused by more intense storms .  The frequency of such extreme weather events and the probability of them coinciding is increasing, resulting in an intensification of severe consequences.

If you are working on a project or your organisation needs a long term view of flooding hazards to protect property and infrastructure assets or satisfy ESG disclosure requirements, then FloodMap Climate can help.

Data Specification

Modelled:

1-in-30 years, 1-in-100 years and 1-in-500 years return periods, undefended.

Climate Epochs & Emissions Scenarios

2020’s, 2050’s and 2080’s

RCP2.6, RCP4.5 and RCP8.5

Layers:

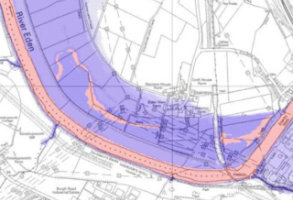
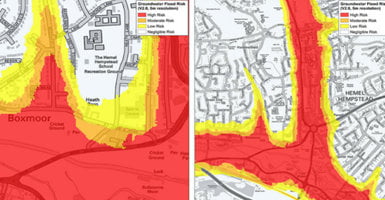
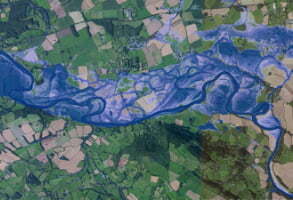
  • Fluvial (river) flooding
  • Pluvial flooding (surface water, flash flooding)
  • Tidal flooding (sea, estuary and coastal)
  • Sea-level rise (shows low and high tide lines)
  • Sea-level rise inundation areas – zones that are subject to inundation due to sea-level rise rather than as a result of a specific flood event
  • River-bank and bed erosion potential for each 100-metre river segment’


Technical Details

Supplier
Twinn (formerly Ambiental)
Update Cycle
Annually (April)
Coverage
GB
Formats Available
TIF, SHP
Licence Options
Annual
Delivery Timescale
Same day (depending on extent ordered)

Related Products

Groundsure Flood Insight, OS VectorMap Local Raster

Download Samples

Twinn FloodScore Climate

Current and future climate-related, property-level flood risk information for GB, including flood depths, risk rating, AAL and ADR, from Twinn (formerly Ambiental)

Product Details

FloodScore Climate provides a view of climate-related, property-level flood risk information for Great Britain.  The product provides an estimate of the likelihood and severity of climate-related flood hazards affecting each individual property and is intended for use by property investors, mortgage lenders, property owners (e.g.  Housing Associations) and insurers.

FloodScore Climate adopts UK Climate Projections 2018 (UKCP18) data to model future climate.  This is modelled in three epochs for four future CO2/Greenhouse Gas emissions scenarios (known as Representative Concentration Pathways – RCP) and six return periods.  The product provides estimates for flood depths for each property address in defended and undefended situations along with undefended risk ratings (i.e.  FloodScore), average annual loss (AAL) and annual damage ratio (ADR) information for each flood source.  The product includes UK FloodScore (the current view of flood risk).

Why is the product important?
The product enables customers to estimate the long view of flood risk as it applies to their asset portfolio and satisfy disclosure requirements of various Environment & Social Governance (ESG) reporting frameworks.  

Technical Details

Supplier
Twin (formerly Ambiental)
Update Cycle
Twice per year
Coverage
GB
Formats Available
CSV
Delivery Timescale
Next day

Related Products

Download Samples

JBA Comprehensive Flood Model map

JBA 5m GB Flood Map

Flood hazard information at postcode and property level for different flood types and return periods.

Product Details

JBA 5m GB Flood Map provides flood hazard information for different flood types and return periods at 5 metres resolution, including easy to use Flood Scores and Floodability ratings.

The product provides flood hazard information for river, surface water, ground water (chalk areas) and coastal flooding for up to five return periods in defended and undefended scenarios, including flood depth and extent data.  The JBA 5m GB Flood Map is maintained with a regular update cycle driven by the availability of the latest science and improvements to underlying datasets (e.g. terrain data).

  • River - defended and undefended
  • Surface - defended and undefended
  • Groundwater (chalk areas)
  • Coastal - defended (Eng&Wales, including wave overtopping), undefended (including breach modelling)


Return Periods
The output from the modelling includes flood outlines and flood depth grids in five depth bands for up to five return periods (20-year; 75-year; 100-year; 200-year and 1,000-year Return Periods).

​JBA’s GB Flood Scores summarise the JBA 5m GB Flood Map information into a single score per flood type, including or excluding the consideration of defences, and a combined score for all flood types (ranging from 0 to 53).

 JBA’s Floodability data are an easy to use colour rating scheme, banding the GB Flood Scores into 6 risk classes ranging from No Colour (“very low”) to Black2 (“very high”).


Technical Details

Supplier
JBA
Update Cycle
Annual
Coverage
UK
Scale
Large urban areas 1-2m resolution Lidar; 5m resolution data elsewhere
Formats Available
CSV and SHP
Licence Options
Annual
Delivery Timescale
On request

Related Products

Groundsure Flood Insight,  OS VectorMap Local Raster

Download Samples

Data samples are for evaluation purposes only.  JBA accepts no liability.

DWG

SHP

I want to buy this product

Image showing where might flood on the landscape

Twinn FloodMap 4™

Property-level flood risk model (fluvial, pluvial, tidal and groundwater) at 5m resolution from Twinn (formerly Ambiental).

Product Details

An accurate and easy-to-understand property-level, flood risk model which provides a high-resolution, 5-metre flood map consistently across the whole of Great Britain.  FloodMap4™ is used to visualise, assess, and understand potential flood risk by insurers, government agencies, property developers, property owners and emergency responders. Flood maps for Northern Ireland and the Channel Islands (Guernsey, Jersey) are also available and are licensed separately. 

FloodMap4™ considers multiple flooding sources (fluvial, pluvial, groundwater and tidal), each modelled separately to provide flood footprints and flood depths for six return periods.  The product models 30% more rivers than other products by modelling further up the catchment area.  It uses Environment Agency LiDAR remote sensing data, supplemented by Bluesky’s Digital Terrain Model data.  The LiDAR data covers the majority of the UK’s residential and commercial properties.

FloodMap4™ makes use of Ordnance Survey VectorMap District building outlines and land cover to model infiltration and drainage rates.  The modelling approach is guided by the UK Centre for Ecology and Hydrology methodology to simulate complex river (fluvial) flood flows, tidal storm/surge, and intense rainfall-driven (pluvial) urban flood events, taking into account distribution of rainfall intensity over time, land cover types (roughness), and varying drainage and infiltration characteristics.

Technical Details

Supplier
Twinn (formerly Ambiental)
Update Cycle
Annually (in April)
Coverage
GB, separate datasets are available for NI and Channel Islands
Formats Available
TIF
Licence Options
Minimum 12 month licence with discounts applied to 3-year contract terms
Delivery Timescale
Next day

Related Products

Groundsure Flood Insight, OS VectorMap Local Raster

Download Samples

Sample data is provided for evaluation purposes only.

BW TIF

I want to buy this product

Illustration of houses showing flood risk score

Twinn FloodScore

Provides current-view, property-level flood risk information for GB, including flood depths, risk rating, AAL and ADR, from Twinn (formerly Ambiental)

Product Details

Twinn FloodScore indicates the current view of the likelihood and severity of climate-related flood hazards affecting individual properties (fluvial, pluvial and tidal). The provides estimates for flood depths in defended and undefended situations along with undefended risk ratings, average annual loss (AAL) and annual damage ratio (ADR) values for each flood type. Where a property address point is not situated within a modelled flood extent, the distance to the nearest floodplain is indicated.

FloodScore is based on the Twinn FloodMap4 product and is intended for use by the property investors, mortgage lenders property owners and insurers.  Property owners who demonstrate an understanding of flooding hazard and risk often benefit from reduced investment rates and reduced insurance premiums.

Each property address is considered as a buffered point (Lat/Long) depending on property type. The maximum flood depth within the buffered area is considered for each flood source and each return period and the likelihood of flooding is expressed as a return period which is a measure of the average recurrence interval of a specific flood event.  The property buffer is used to avoid understating the level of risk where a property may be shown to be flooding within its footprint, but the flood extent does not intersect the property centroid.

FloodScore estimates property-level loss in Pounds Sterling (£) for each flood source and return period based on standard industry figures of rebuild/reinstatement costs for a national average residential property.  Values are provided for average annual loss (£AAL), annual damage ratio (ADR) and an overall risk rating

Technical Details

Supplier
Twinn (formerly Ambiental)
Update Cycle
Quarterly
Coverage
UK
Formats Available
Supplied as a single CSV file
Licence Options
Annual
Delivery Timescale
Next day

Related Products

Download Samples

Samples coming soon.

Coming soon.......

Twinn Groundwater Flood Map

Combined chalk-areas and national-scale groundwater flood map for GB from Twinn (formerly Ambiental).

Product Details

Twinn Groundwater FloodMap is a screening tool for identifying flooding as the water table rises, likely to affect surface and sub-surface assets (e.g. basements). Combines flood hazard data for chalk-areas and national-scale areas for each return period. Validated and calibrated regularly using information from actual flood events.

Groundwater FloodMap is a companion dataset to FloodMap4 and provides an even more comprehensive view of flood hazard.  It combines comprehensive data on geology, permeability, and historic groundwater levels to provide insight into the actual risk of groundwater flooding for a 1 in 100-year return period using a 5-point scoring system from negligible (0) to high (4).  The basement impact model also indicates where groundwater levels may rise to coincide with basement structures (i.e. 2-3 metres below ground level).


Why is the product important?
Twinn Groundwater FloodMap provides a view of a flood hazard which is often overlooked.  Groundwater flooding is a significant threat to construction projects, utility infrastructure and property value generally and usually persists long after the weather event that triggered it.  Twinn Groundwater FloodMap is useful for construction companies, property developers, property investors and mortgage lenders, property owners, asset managers, utility companies and insurers.


Please note: The Sample to the right is for evaluation use only.

Technical Details

Supplier
Twinn (formerly Ambiental)
Update Cycle
Annually
Coverage
GB
Formats Available
TIF, SHP
Delivery Timescale
Same day

Related Products

Groundsure Flood Insight, OS VectorMap Local Raster

Download Samples

BGS Groundwater Flooding map

BGS Groundwater Flooding

GB susceptibility model indicating where groundwater may come close to the ground surface

Product Details

BGS Groundwater Flooding is a 1:50,000 scale dataset indicating the degree to which areas may be susceptible to groundwater flooding. Data is presented in four groundwater flooding classes, including surface and sub-surface, with a confidence dataset and advice on what action to take based on the classification.

Groundwater flooding is the emergence of groundwater at the ground surface. It can occur in a variety of geological settings including valleys in areas underlain by Chalk, and in river valleys with thick deposits of alluvium and river gravels. Groundwater flooding happens in response to a combination of already high groundwater levels (usually during mid- or late-winter) and intense or unusually lengthy storm events. Groundwater flooding often lasts much longer than other flooding types and usually persists long after the weather event which triggered it causing significant social and economic disruption to affected areas.

Data is available in Shapefile or Tab file format.


Technical Details

Supplier
British Geological Survey
Update Cycle
Annual
Coverage
GB
Formats Available
SHP
Licence Options
Annual
Delivery Timescale
Same day

Related Products

Groundsure Flood InsightOS 1:50 000 Raster

Download Samples

BGS SuDS data map

BGS SuDS

BGS SuDS (Sustainable Urban Drainage Systems) can be used for preliminary decision making on the most appropriate type of infiltration drainage system for a site.

Product Details

This dataset is suitable for those involved in the planning and design of sustainable drainage systems (SuDS) and for those who approve SuDS planning applications within local authorities.

The dataset provides a preliminary indication of the suitability of the ground for infiltration drainage systems such as soakaways, infiltration basins, infiltration trenches and permeable pavements.  It should be complemented by site investigation.

The selection and design of an appropriate system depends on the properties of the ground including:

  1. the presence of severe constraints that must be considered prior to planning infiltration
  2. the drainage potential of the ground
  3. the potential for ground instability when water is infiltrated
  4. the protection of groundwater quality

The BGS Infiltration SuDS map is based on 15 nationally derived subsurface property datasets, some of which are a result of direct observations, whilst others rely on modelled data.  It allows consideration of the subsurface permeability, the depth to groundwater, the presence of geological floodplain deposits, the presence of artificial ground, ground stability (soluble rocks, collapsible ground, compressible ground, running sand, shallow mining, landslide and shrink–swell clays), potential for pollutant attenuation and the Environment Agency's source protection zones.

Technical Details

Supplier
British Geological Survey
Coverage
GB
Scale
1:50,000
Formats Available
SHP, TAB
Licence Options
Annual
Delivery Timescale
Same day

Related Products

JBA Comprehensive Flood Model, Groundsure Flood Insight

Download Samples

SuDS (Summary) sample: TAB, SHP

SuDS (Detailed) sample: TAB, SHP


I want to buy this product


Phone & Email

Address

Building A2 (Office 1052) Cody Technology Park Old Ively Road
Farnborough
GU14 0LX
United Kingdom