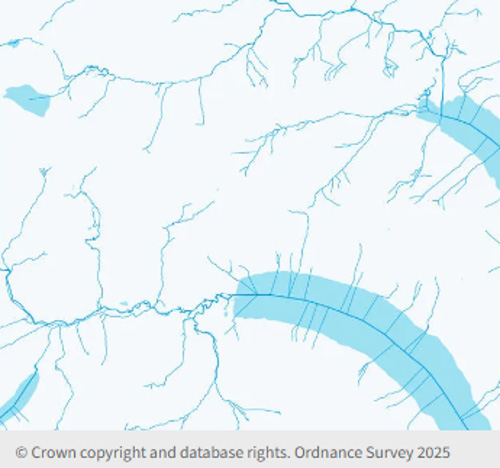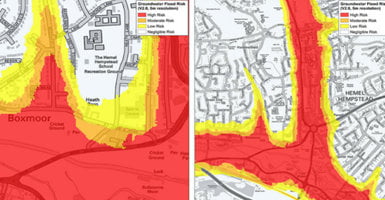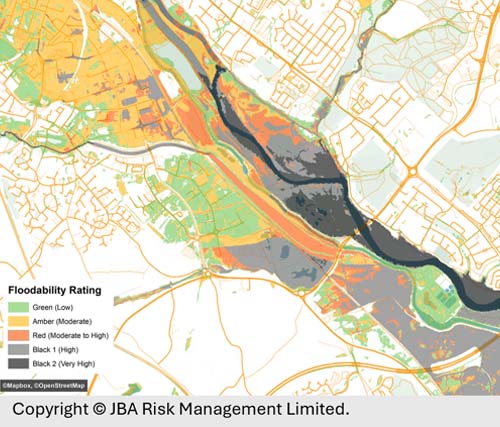
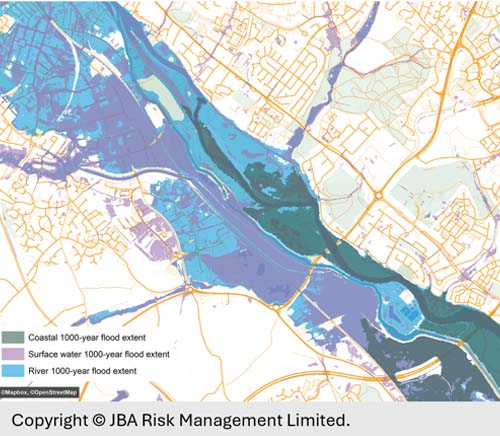
Twinn Floodmap Climate
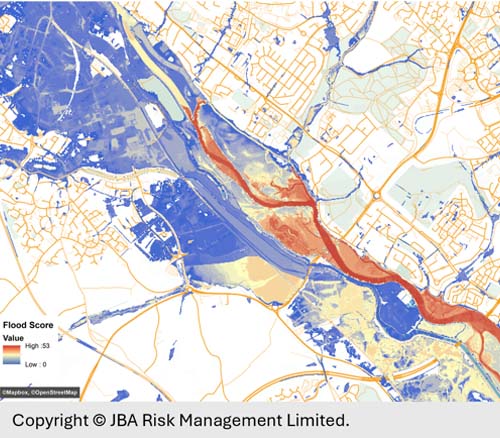
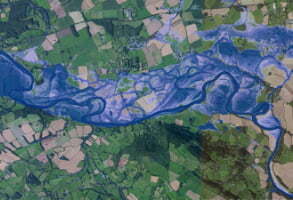
Twinn Floodmap Climate is a high-resolution, climate adjusted flood map using local hydrological data, high-resolution terrain models, and climate uplift data to create a view of current and future hazards (fluvial, pluvial and tidal). It provides a view of current and future, undefended flood hazards (fluvial, pluvial and tidal) for three return periods, three time horizons and three emissions scenarios to estimate potential impact on projects and asset portfolios and to satisfy ESG disclosure requirements.
- • Undefended
- • Climate Epochs (2020’s, 2050’s and 2080’s)
- • Emissions Scenarios (RCP2.6, RCP4.5 and RCP8.5)
- • Return Periods (1-in-30, 1-in-100 and 1-in-500 years)
Twinn Floodmap Climate also indicates expected sea level rise (low and high tide lines) and areas subject to inundation due to sea-level rise rather than as a result of a specific flood event. Plus river-bank and erosion potential for each 100-metre river segment.